 PARDESCO
Fractals & coloring
The Mandelbrot Set, Explained Visually
One tiny equation draws the most famous shape in fractal geometry. Here is what the Mandelbrot set means, how a browser renders it, and where to zoom first.

The Mandelbrot set is the black, bulb-shaped figure that became the gateway image for fractals. Its outline is instantly recognizable; its meaning is less obvious. The short answer is:
The Mandelbrot set is a map of which complex-number seeds stay bounded when the rule z → z² + c is repeated from z = 0.
That one sentence contains the whole definition. The colored picture around the set is a visualization of how quickly the other seeds escape. Open the exact full-set view below and zoom anywhere along the black boundary:
◆ Open in StudioExplore the full Mandelbrot setDrag to pan and scroll to zoom. Every new view is calculated live in your browser.What the Mandelbrot set actually represents
Each pixel in a Mandelbrot image stands for a complex number c. Complex numbers can be plotted like ordinary coordinates: the real component runs left–right and the imaginary component runs down–up.
For each pixel, the renderer starts with z = 0 and repeats:
zₙ₊₁ = zₙ² + c
Two things can happen:
- The values remain bounded no matter how long the process continues. That pixel belongs to the Mandelbrot set.
- The values grow beyond every limit. That pixel lies outside the set.
The familiar black cardioid and its attached circles are the bounded points. The boundary is not a stroke drawn around them; it is the exact transition between bounded and escaping behavior.
This is also why the Mandelbrot set is not the identity of the whole Studio. It is one mathematical source. The same transform, gradient, animation, and finish tools can work with Julia sets, geometric fields, tilings, and quasicrystals.
How the escape-time algorithm draws it
A browser cannot run an infinite test for every pixel, so it uses an escape-time algorithm:
- Assign the pixel coordinate to c.
- Begin at z = 0.
- Repeat z² + c up to a maximum iteration count.
- Stop early if the orbit's magnitude exceeds the escape radius.
- Color the pixel by the iteration at which it escaped.
Points that escape quickly receive one part of the gradient; slower points receive another. Points that do not escape before the limit are treated as interior. As you zoom, the Studio automatically raises the iteration count because deep boundary views need more work to separate slow escape from true boundedness.
“Smooth” coloring estimates a fractional escape time instead of showing only whole-number bands. It removes contour steps while leaving the underlying membership test unchanged.
Why the boundary has infinite detail
The interior of the Mandelbrot set contains broad, stable regions. The exterior eventually escapes. The boundary is where tiny changes to c can change the long-term fate of the orbit.
That sensitivity produces structure at every scale. Zoom into a filament and it branches. Zoom into a branch and spirals appear. Around many spirals are tiny Mandelbrot-like copies called minibrots, linked back to the larger set by threads too fine to see at the previous scale.
The set itself is bounded—it fits inside a finite part of the complex plane. Its boundary detail is inexhaustible. A real computer eventually runs into floating-point precision and performance limits, but the mathematical object does not become a smooth curve beyond some magnification.
Where to zoom: Seahorse Valley
Seahorse Valley is one of the classic first destinations. It lies near the boundary between the main cardioid and a large circular bulb. Its chains of spirals resemble curled seahorse tails, with smaller curls repeating around them.
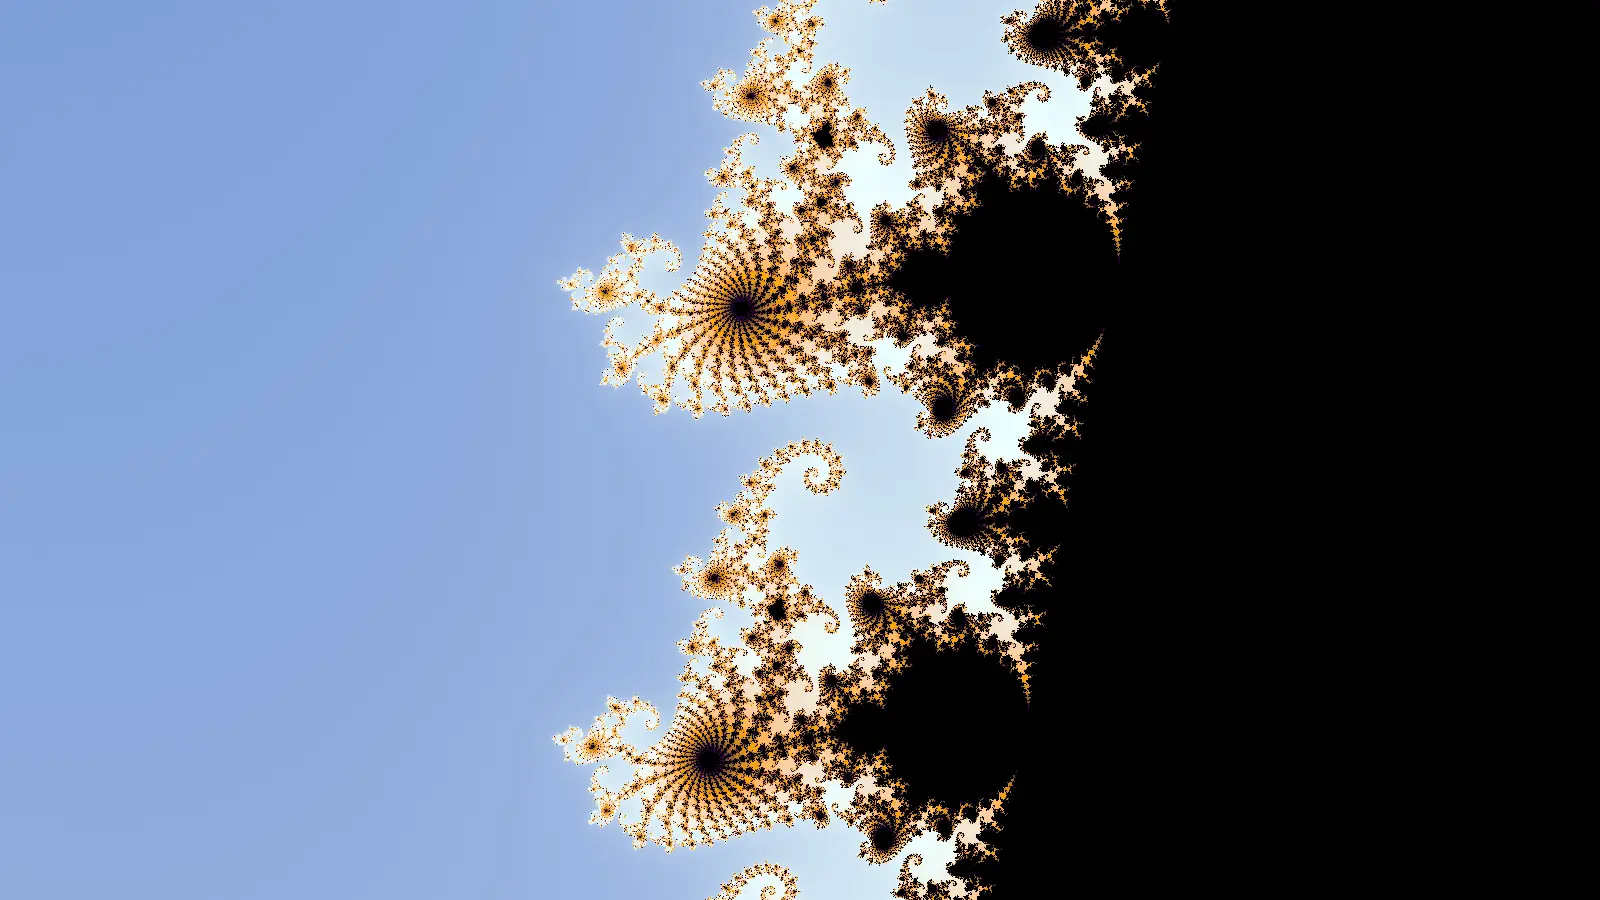
The coordinate in this demo is intentionally precise, but there is no single correct “Seahorse Valley picture.” A small move or a deeper zoom reveals a different member of the same family. Pan along the pale boundary and follow the spiral arms rather than staying locked to the starting coordinate.
Mandelbrot set images are interpretations
Search results show blue Mandelbrots, fire-colored Mandelbrots, neon Mandelbrots, and stark black-and-white versions. They are not different sets. The membership calculation can be identical while the coloring algorithm, gradient, density, and interior treatment change.
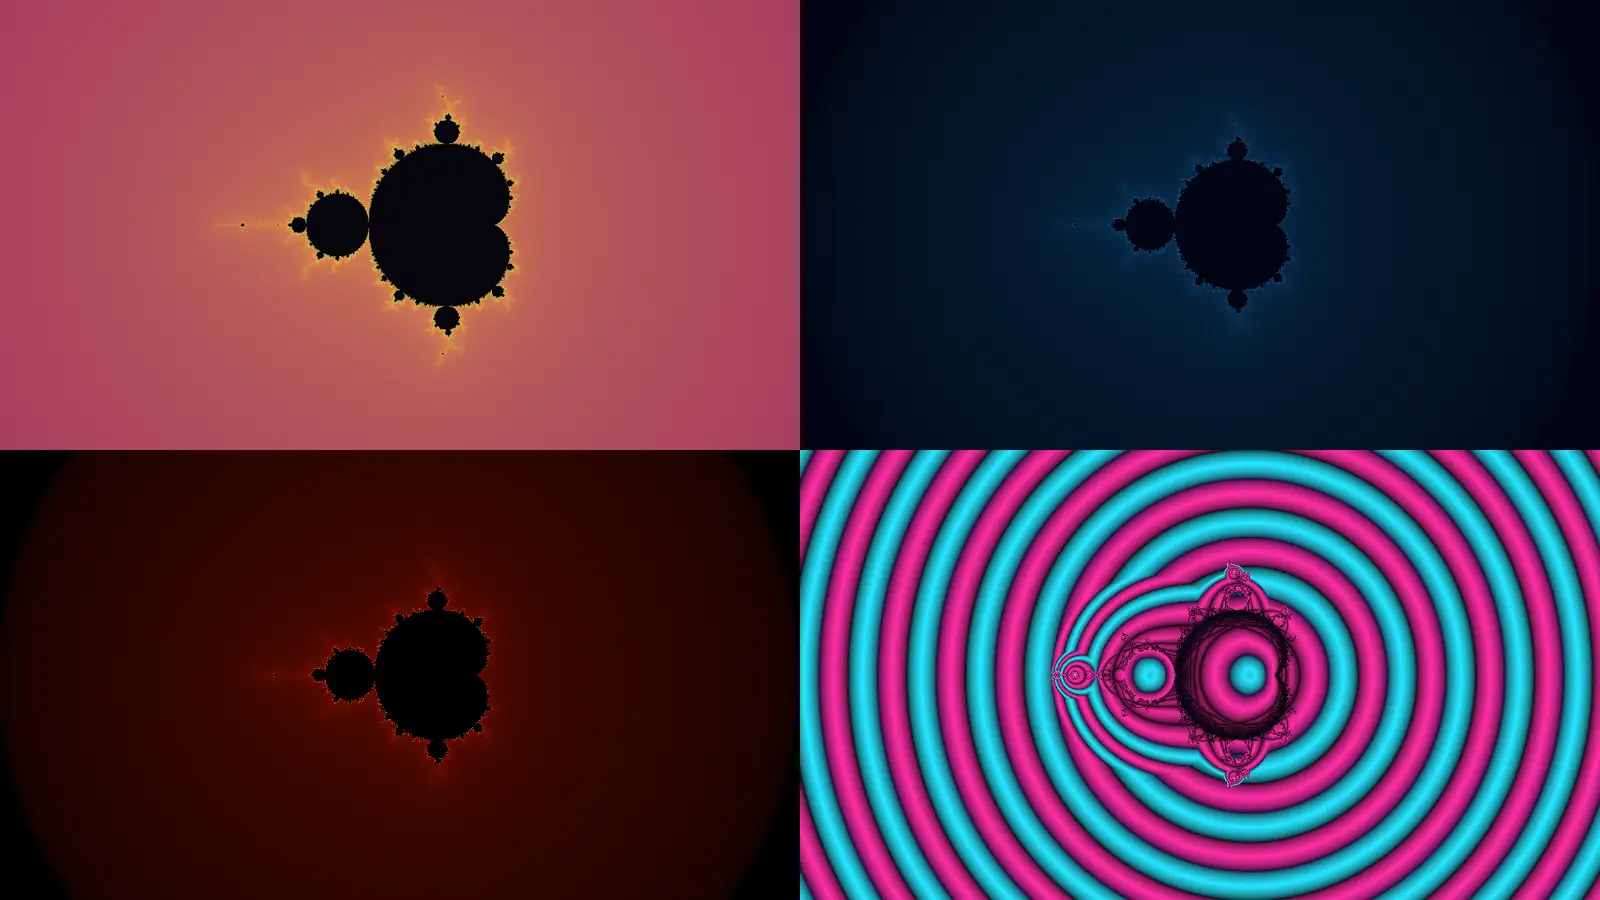
The topological facts remain fixed: which points belong, which escape, and how the boundary connects. The image changes because we choose a different way to translate orbit data into color.
That distinction is useful for both learning and art. Start with a camera view that has interesting structure, then treat coloring as a separate design pass. Changing the palette does not destroy the coordinate you discovered.
Smooth coloring, distance estimation, and orbit traps
Escape time answers “how many iterations passed before escape?” Other coloring methods ask different questions about the same orbit.
Distance estimation
Distance estimation tracks a derivative during iteration and estimates how far an exterior point lies from the boundary. It can reveal thin filaments with a crisp, embossed quality that smooth bands often soften.
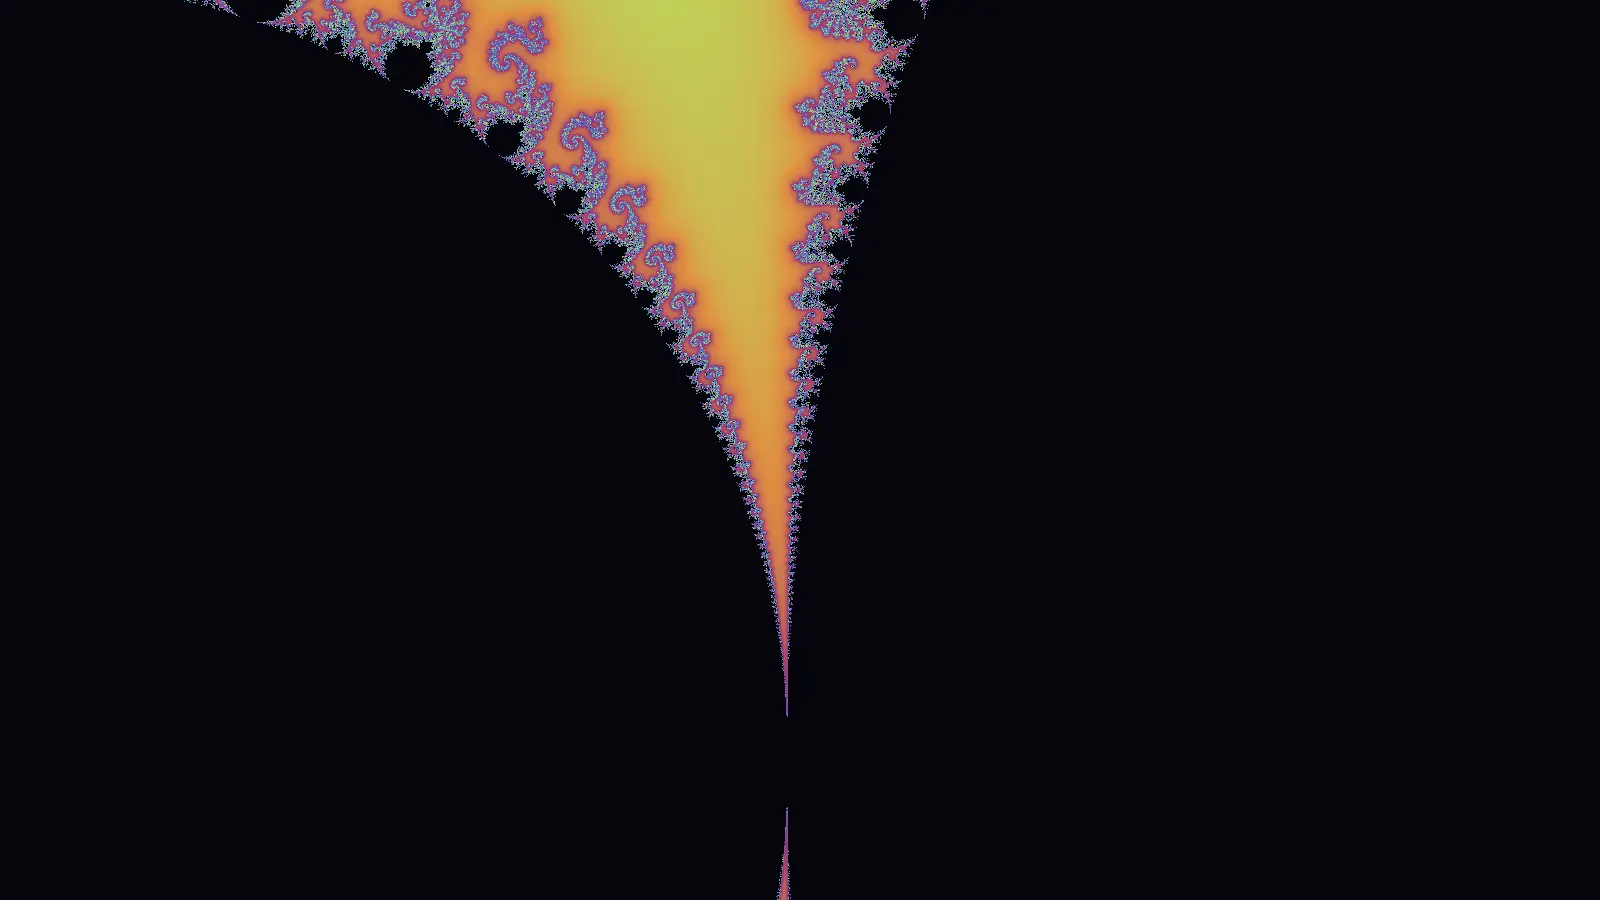
Use it when the shape of the boundary matters more than broad atmospheric color. At very deep zooms it can make otherwise faint threads legible.
Orbit traps
An orbit trap measures how closely the iterated values pass a chosen shape, such as a ring or cross. Instead of describing only the moment of escape, it records something about the route the orbit took.
◆ Open in StudioOpen the Mandelbrot set with a ring orbit trapOrbit traps color the path taken by each point instead of only recording escape time.Orbit traps can color interior regions as well as the exterior, which makes the same Mandelbrot geometry feel radically different. The result is still driven by the quadratic orbit; the “trap” is a lens applied to its path.
Mandelbrot and Julia sets: parameter plane versus dynamical plane
The Mandelbrot and Julia sets are two views of the same formula:
- The Mandelbrot set begins at z = 0 and varies c across the image.
- A Julia set fixes one c and varies the starting value of z.
The Mandelbrot plane is therefore a map of the Julia family. If a point c lies inside the Mandelbrot set, its filled Julia set is connected. If c lies outside, the corresponding Julia set is disconnected.
Explore that relationship with three exact seeds in Julia Sets, Interactively.
A practical first exploration
If this is your first live Mandelbrot session:
- Open the full-set demo.
- Zoom toward a busy boundary—not into the featureless black interior or far into the smooth exterior.
- Pan to keep filaments centered as they expand.
- Try Smooth bands and Distance field on the same camera.
- Change the gradient only after choosing a view.
- Copy the URL to preserve the exact coordinate, scale, and effects.
Then leave the gateway fractal and compare other kinds of generative structure. Penrose tilings never repeat because of substitution rules rather than escape-time dynamics, while ordered dithering changes how continuous color is displayed. The cool fractals gallery collects more editable patterns built from the Studio's broader toolset.
Frequently asked
What is the Mandelbrot set in simple terms?
The Mandelbrot set is a map of complex-number seeds for the repeated rule z → z² + c. A seed belongs to the set when the orbit starting at z = 0 stays bounded instead of escaping to infinity.
Why is the Mandelbrot set a fractal?
Its boundary has detail at every scale. Zooming reveals new spirals, filaments, and miniature copies without reaching a final smooth edge. That scale-dependent complexity is a defining feature of a fractal.
Is the Mandelbrot set infinite?
The set fits inside a finite region of the complex plane, but its boundary has unlimited detail. You can continue zooming mathematically without exhausting its structure, although computers eventually reach numerical precision limits.
What equation creates the Mandelbrot set?
The standard quadratic Mandelbrot set uses zₙ₊₁ = zₙ² + c, beginning with z₀ = 0. Each pixel supplies a different value of c.
What is the difference between the Mandelbrot set and a Julia set?
The Mandelbrot set varies c while always starting z at zero. A Julia set fixes c and varies the starting value of z. A Mandelbrot point predicts whether the corresponding Julia set is connected.
Can I explore the Mandelbrot set online?
Yes. The Open in Studio links on this page launch exact browser-rendered views. You can pan, zoom, change coloring, add transforms, and share the resulting state without an account.
Studio dispatches
New work, new writing — straight to you
Occasional letters from the studio. No spam, unsubscribe anytime.